visx
A collection of reusable low-level visualization components
README


![]()


![]()
visx
visx is a collection of reusable low-level visualization components. visx combines the power of d3
to generate your visualization with the benefits of react for updating the DOM.
•
Gallery •
Blog •
Slack #visx •
Changelog •
Getting started tutorial 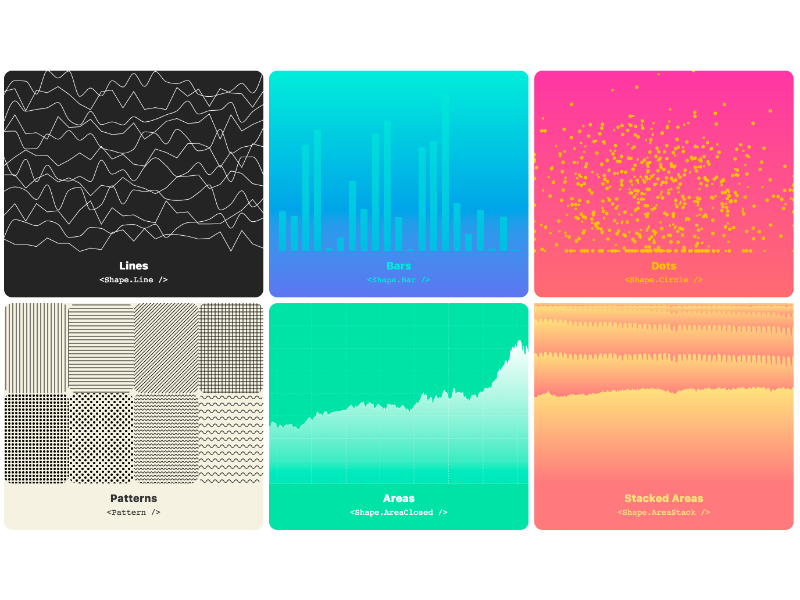
Usage

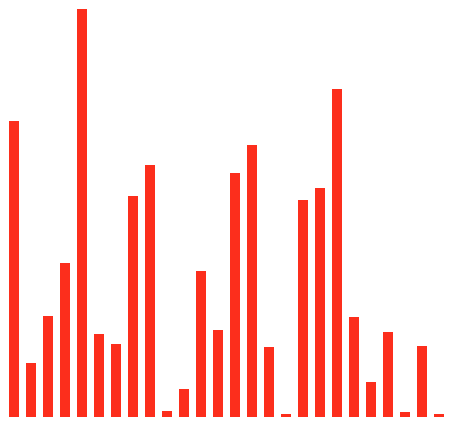
Let's make a simple bar graph.
First we'll install the relevant packages:
- ``` sh
- npm install --save @visx/mock-data @visx/group @visx/shape @visx/scale
- ```
- ``` js
- import React from 'react';
- import { letterFrequency } from '@visx/mock-data';
- import { Group } from '@visx/group';
- import { Bar } from '@visx/shape';
- import { scaleLinear, scaleBand } from '@visx/scale';
- // We'll use some mock data from `@visx/mock-data` for this.
- const data = letterFrequency;
- // Define the graph dimensions and margins
- const width = 500;
- const height = 500;
- const margin = { top: 20, bottom: 20, left: 20, right: 20 };
- // Then we'll create some bounds
- const xMax = width - margin.left - margin.right;
- const yMax = height - margin.top - margin.bottom;
- // We'll make some helpers to get at the data we want
- const x = d => d.letter;
- const y = d => +d.frequency * 100;
- // And then scale the graph by our data
- const xScale = scaleBand({
- range: [0, xMax],
- round: true,
- domain: data.map(x),
- padding: 0.4,
- });
- const yScale = scaleLinear({
- range: [yMax, 0],
- round: true,
- domain: [0, Math.max(...data.map(y))],
- });
- // Compose together the scale and accessor functions to get point functions
- const compose = (scale, accessor) => data => scale(accessor(data));
- const xPoint = compose(xScale, x);
- const yPoint = compose(yScale, y);
- // Finally we'll embed it all in an SVG
- function BarGraph(props) {
- return (
- <svg width={width} height={height}>
- {data.map((d, i) => {
- const barHeight = yMax - yPoint(d);
- return (
- <Group key={`bar-${i}`}>
- <Bar
- x={xPoint(d)}
- y={yMax - barHeight}
- height={barHeight}
- width={xScale.bandwidth()}
- fill="#fc2e1c"
- />
- </Group>
- );
- })}
- </svg>
- );
- }
- // ... somewhere else, render it ...
- //
- ```
For more examples using visx, check out the gallery.
Motivation
Goal
The goal is to create a library of components you can use to make both your own reusable chart
library or your slick custom one-off chart. visx is largely unopinionated and is meant to be built
upon. Keep your bundle sizes down and use only the packages you need.
How?
Under the hood, visx is using d3 for the calculations and math. If you're creating your own awesome
chart library on top of visx, it's easy to create a component api that hides d3 entirely. Meaning
your team could create charts as easily as using reusable react components.
But why?
Mixing two mental models for updating the DOM is never a good time. Copy and pasting d3 code into
componentDidMount() is just that. This collection of components lets you easily build your own
reusable visualization charts or library without having to learn d3. No more selections or
enter()/exit()/update().
Roadmap
Lots coming soon, check out the roadmap.
In the wild
(Demo)
(Demo)
(Tutorial)
- Collapsible tree with [react-move](https://github.com/react-tools/react-move) by
- Bitcoin 30-day price by @hshoff
(Github)
(YouTube)
- Ethereum candlestick chart by @hshoff
(Github)
- Song data visualization through spotify by @bother7
(Demo)
(Github)
- Investment Calculator (website)
- Animation with [react-spring](https://github.com/drcmda/react-spring/) by
- Code Coverage Dashboard by @ezy
(Demo)
(Github)
- Ethereum Portfolio Toolkit by @JayWelsh
- Family tree by @vkallore
(Github)
- South African Coronavirus Data Visuals by @JayWelsh
by @rayshan
(Demo)
- Dollar to food emoji caculator by @gmlwo530
(Demo)
(Github)
- [zh-TW] Taiwan Real-time Air Quality Index by
- tokenized BTC on ethereum stacked chart with brush by
Have a project that's using visx? Open a pull request and we'll add it to the list.
FAQ
1. What does visx stand for?
> visx stands for visualization components.
1. Do you plan on supporting animation/transitions?
> A common criticism of visx is it doesn't have animation baked in, but this was a conscious
> choice. It's a powerful feature to not bake it in.
>
> Imagine your app already bundles react-motion, adding a hypothetical @visx/animation is
> bloat. Since visx is react, it already supports all react animation libs.
>
> Charting libraries are like style guides. Each org or app will eventually want full control
> over their own implementation.
>
> visx makes this easier for everyone. No need to reinvent the wheel each time.
>
> more info: https://github.com/airbnb/visx/issues/6
>
> examples:
>
> - Collapsible tree with [react-move](https://github.com/react-tools/react-move) by
> (Radial demo)
> - Animation with react-spring by @drcmda
> (Demo)
1. Do I have to use every package to make a chart?
> nope! pick and choose the packages you need.
1. Can I use this to create my own library of charts for my team?
> Please do.
1. Does visx work with preact?
> yup! need to alias react + react-dom and use preact-compat.
1. I like using d3.
> Me too.
Development
Please see CONTRIBUTING.md
:v: